Google has rolled-out its much anticipated CWV (Core Web Vitals) update which means that it will now take these metrics into account in its ranking algorithm, so if you want to maintain or increase your domain’s current visibility in the SERPs, you need to be on top of these.
With that mind, over the past few months, we’ve been developing a brand new Page Experience module which allows you to run tests on webpages, get a report on Core Web Vitals (and other KPIs) for each page and make notes on what improvements you’re testing. You can then quickly run another CWV report to see if those changes have had any positive effect. This tool is currently in beta, keep an eye out for announcements for when it is live for all our users!
Use Cases for Technical SEOs
- Analyse the CWV for the key page templates on your site (probably no need to check every page)
- Track the technical changes and experiments you are making to your pages to improve these Core Web Vitals
- Visualise and monitor this by device type over time
- Bulk upload pages to track a set of competitors, for industry research or on-site optimisation
Getting Started
To get started, you can simply cut and paste one or more URLs into the input field here 👇🏻

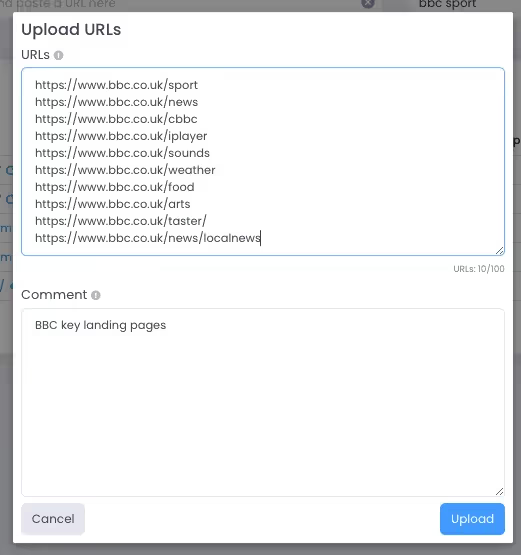
Alternatively, you can make use of the Upload URLs link (shown above) and a dialog window will appear, which will allow you to cut and paste a list of URLs (up to 100 at a time):
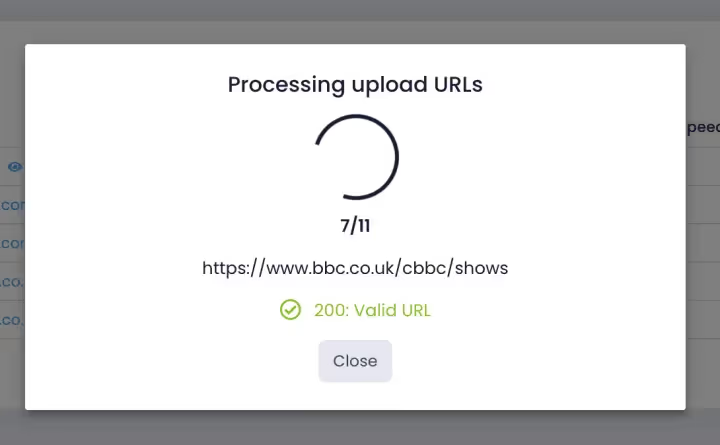
A processing window will then appear as we check every URL for you (only URLs that return a 200 status are worth testing, after all!):
The URLs you have inputted or uploaded will then show up in your Report History table:
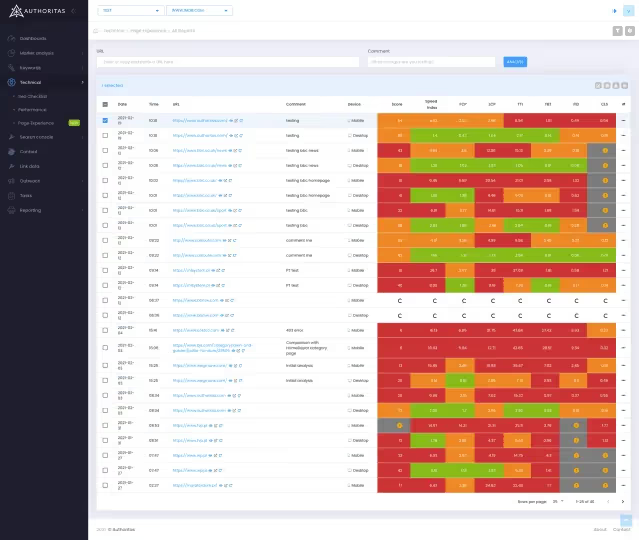
This will give you a summary of the CWV metrics – cells are coloured-coded so you can get a quick insight into where your pages may have issues. The colours match the colour scheme used by Google’s Lighthouse report.
You can filter this URL at any time by making use of the filters in the top right-hand corner of the interface. Filter to a specific domain or a number of domains or filter to a specific folder on a site, if that’s where you optimisation focus currently lies.
From this view, you’ll notice 3 icons next to each URL:

Click on the redo icon to re-run the report, click on the external link to open the URL in a new tab or click on the eye 👁 icon to drill down to the URL level.
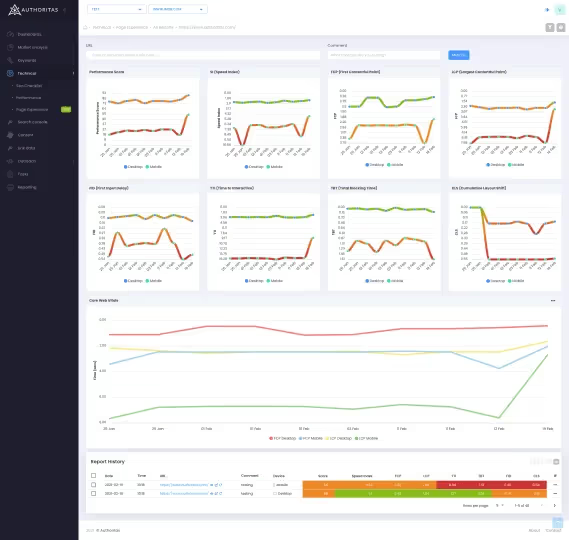
Here, you’ll see a number of widgets that break down the URL’s performance in relation to a Core Web Vitals metric over time. For instance, this is the LCP (Largest Contentful Paint) widget 👇🏻
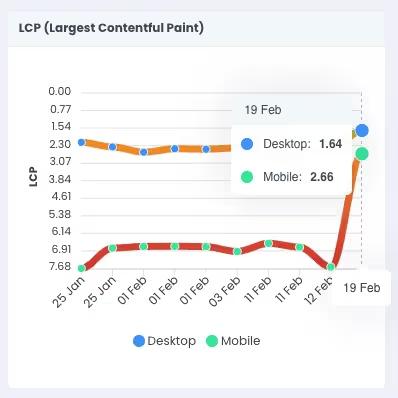
As we run both mobile and desktop tests, you’ll notice that is a good way of assessing whether a page has a particular issue on a particular type of device.
Below the widgets, we display a chart which allows you to compare CWV metrics over time against each other, so you can see where a page is improving its CWV metrics and where it is worsening its performance:
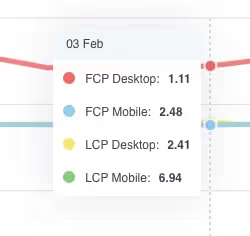
It will also display your comments over time. Finally, below that, there is a table which will display the history of the reports you have run for that particular URL.
You are also able to drill down into the suggested changes from Google Lighthouse by clicking the action button on the right hand side, you will then be able to open the Lighthouse Report and see what changes they suggest to be made.

If you need further help optimising your page for Core Web Vitals and Page Experience, have a look at chapter 4 in the Technical SEO Guide by Koray Tuğberk GÜBÜR, where he drills down into what each metric is and how to optimise for them.


